Showing posts with label Billion Dollar Disasters. Show all posts

Tuesday, November 27, 2012

Comparing the Impacts of Hurricane Sandy to Hurricane Katrina...


Lately I've been hearing lots of folks talk about whether or not Sandy had a greater "impact" than Katrina.  If we look solely at the human toll (with regard to the loss of life), I don't think anyone can argue against the fact that Katrina was far worse than Sandy.  

With that said, and certainly with all due respect and condolences to those who lost friends, loved ones and family members in both events, if we take a look at the "bigger picture" across several types of impacts, Sandy starts to jump right up there in comparison - and not all of the numbers are in yet, either.

A blog post in today's New York Times "City Room" took a look at some of the other major impacts associated with both events:


You can read the full post on the Times blog for more details, as well as the ability to drill down for more information on each of the hyperlinks in the table shown above.

Naturally, with the extremely dense population that was directly impacted by Sandy compared to that of Katrina, the economic and other social impacts were tremendous, and likely unprecedented in modern history.  I noted that the New York Times did not include any reference to the transportation infrastructure (i.e., subways, tunnels, etc.) in their comparison, and that aspect alone puts several notches in Sandy's belt compared to Katrina, especially given the tremendous impact due to the higher population. 

As they point out in the article, this is a highly preliminary look at the situation (with respect to Sandy), as several statistics are still being calculated, and will be for months to come.  

For the record, I strongly disagree with point 1 on the table.  I have been presented with zero compelling evidence (other than unsubstantiated claims from the National Weather Service) that Sandy was "post-tropical" (i.e., not a hurricane) at landfall.

For more information from 'The Original Weather Blog', including shorter, more frequent posts during rapidly changing weather events, please be sure to follow Rob on facebook and twitter:
 
If you are in need of highly customized, site specific weather forecasts and/or storm warnings for your business, school or event, be sure visit my professional webpage at WeatherGuidance.com.

Saturday, December 31, 2011

#1 Weather Disaster of 2011: Southeast / Ohio Valley Tornado Outbreak of April 25-28


The #2 weather disaster of 2011 (the Southern and Southwest Drought)currently carries a price tag estimated at $10 billion, but took place over a period of more than 9 months. This next disaster totaled $10.2 billion in damage and took place in a little more than 3 days!  I'm talking about the widespread, damaging tornado outbreak across the Deep South, Midwest and Ohio Valley of April 25-28 - which has the dubious distinction of ranking as the #1 billion dollar weather disaster of 2011.


The outbreak produced in excess of 350 tornadoes (see table below) and took the lives of 321 people.  Of those killed, 240 were in Alabama alone.  To date, a total of $7.3 billion in insured losses have been paid, with a total damage estimate of $10.2 billion.


Table of tornado outbreak data by state, via Wikipedia


For the duration of this post we'll take a look at the highlights of each day.


Monday, April 25, 2011:


The first day of the outbreak period produced a swath of over 40 tornado reports, extending from northcentral Texas into the mid-Mississippi Valley.


The most significant event of the day took place in Vilonia, Arkansas.  Most of the town was completely destroyed by a large tornado that struck shortly after 7:30 pm that evening.  Four people were killed and numerous others were injured.  Vilonia is located just North of Little Rock.


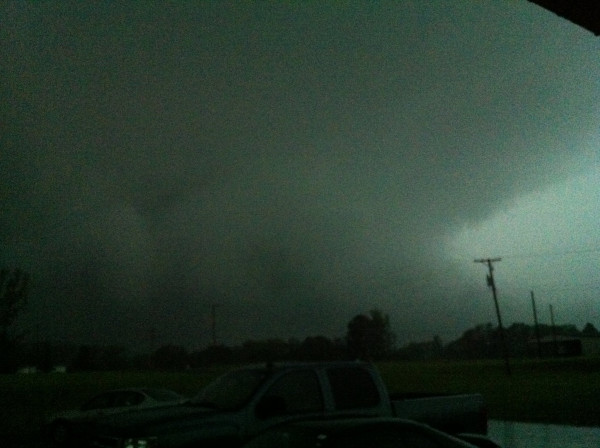
The picture below was taken just outside of Vilonia at about the time the tornado was taking place.  It shows what appears to be a large tornado at least partially obscured by rain:


An image from the Little Rock area doppler radar before the storm struck Vilonia shows a strong tornadic signature on both the reflectivity (rain and hail - left side of image) and velocity (wind speed and direction) images of the radar:


On the same image below, I've noted the location of a "debris ball" in a yellow circle on the reflectivity image and the strong rotational signature in the velocity image with a white circle:


A debris ball is a signature that is indicated when the radar is detecting debris that has been picked up and carried aloft by the tornado.  This is typically only observed with very strong and/or violent tornadoes, and when significant damage is being done.


Indeed, the damage in Vilonia was significant, with many homes completely destroyed or very heavily damaged:


Due to the strong signatures on radar, the city had over 30 minutes of warning before the tornado struck.  Undoubtedly the death toll would have been higher had that not taken place.

Tuesday, April 26, 2011:


On the next day, April 26, over 52 tornadoes were confirmed (of the 100+ reports received as noted on the map above), in a swath from northeast Texas across the Deep South and middle Tennessee Valley.  A few isolated tornadoes also took place in Michigan and New York state.

The strongest tornado that took place on the 26th was of EF-3 intensity, near Fort Campbell, Kentucky.  One structure was completely destroyed and several others heavily damaged on the Ft. Campbell Army Airfield, and several barns and homes in the city were also damaged or destroyed.

Unfortunately, the tornado events of the 25th-26th turned out to be only a "preview" of what was to come the following day... which would prove to be the most deadly and widespread tornado day in recent U.S. weather history...

Wednesday, April 27, 2011:


On April 27th, 2011, the most significant tornado outbreak in over 35 years took place across much of the Eastern third of the U.S.  Just over 200 tornadoes were confirmed on that day which shattered the old record of 148 twisters during the Super Outbreak of April 3-4, 1974.


The image below shows the preliminary tornado tracks across the South:


The following image illustrates the "killer" tornado paths of that day.  A total of just over 300 people were killed by 28 different tornadoes:


Hundreds of tornado warnings were issued from the lower Mississippi Valley into the Northeast on April 27th, a record number for any one day in U.S. weather history.  One National Weather Service ("NWS") office alone (Huntsville, AL) issued 92 tornado warnings on that day.  


Over 90% of the tornadoes that took place on April 27th did so inside of a Tornado Warning area, and 100% of the tornadoes took place within a Tornado Watch area.  These statistics make the staggering death toll of 300+ even harder to accept, at least when applying "conventional wisdom".  As it turns out, conventional wisdom isn't a very good barometer to use when it comes to the strongest of tornadoes, especially those of EF-4 and EF-5 intensity that track through heavily populated areas.


As the events one month later in Joplin, MO would further illustrate, seeking shelter above ground, as conventional wisdom would suggest (i.e., in a small interior room on the lowest floor of your home or business), is no match for a high end EF-4 or any EF-5 tornado.  A specially designed, below ground tornado shelter or an above ground tornado safe room offer the best chances of survival in these situations.


There were many "stand out" tornadoes that took place on April 27th (11 were of EF-4 intensity and 4 were of EF-5 intensity).  The events that took place in Alabama were particularly deadly and damaging.  In particular, the tornado that tore a swath of destruction from near Tuscaloosa: 


...to Birmingham:


...was on the ground for nearly 81 miles and had a damage path width of 1.5 miles at times.  The official NWS survey of the tornado damage path is shown on the following 3 images.  The colored triangles along the damage path refer to specific EF-intensity categories:  Blue = EF-0, Green = EF-1, Yellow = EF-2, Gold/Brown = EF=3, Red = EF-4:  


This tornado killed 64 people and injured at least 1500.  The official NWS survey rated this tornado EF-4, although I still contend that EF-5 damage was present at some points along the path, particularly in the Tuscaloosa area.


The supercell thunderstorm that produced the Tuscaloosa to Birmingham tornado was one of the longest lived (if not the longest lived) tornado producing thunderstorms of the day.  As you can see by the composite radar image below, the storm tracked from east-central Mississippi into southwestern North Carolina (a distance of over 350 miles) and was producing tornadoes most of the time!


I have made several posts on the blog this year regarding the Tuscaloosa and Birmingham area tornado.  You can view those individual posts here:


More on Tuscaloosa, AL Tornado of 4-27-11


Areal Footage of Tuscaloosa, AL Tornado of 4-27-11


Radar Imagery Associated with the Tuscaloosa Tornado


More on Birmingham, AL Tornado of 4-27-11


Another violent tornado, rated EF-5 intensity, tracked to the North of Birmingham on the 27th, impacting the Athens and Huntsville areas (among others in the region):  


This particular tornado was on the ground for 107 miles across north Alabama and extreme southeast Tennessee.  It produced a damage path up to 1.25 miles wide and killed 72 people.  


At least one major good came from the tragedy near Athens, thanks to this photo:


That is the Harrison family - and they were indeed saved by their tornado saferoom on April 27th.  You can see that it is literally the only room left standing in their home.  That photo and their story received world wide media attention (including here on the Original Weather Blog), and brought the issue of tornado saferooms and sheltering to the forefront of many peoples minds.


It is my hope that their story, as well as the story of Sam from Joplin, MO will lead many to purchase and install a tornado saferoom before the 2012 tornado season gets underway.


The Athens/Hunstville area tornado originated back to the Southwest near Phil Campbell, where several cases of EF-5 damage were observed, in that the foundations of frame built homes were wiped completely clean, as shown in this photo below (near Phil Cambpell):


Another tornado tracked between Birmingham and Huntsville, near Empire, AL on the 27th. This tornado took place in a rural area with no notable damage or injury (thank goodness), but I wanted to point it out and show this video to try and put to rest a widespread myth that tornadoes cannot travel over hills, mountains or other rugged terrain:


As you can see, this particular tornado had no problem with the rugged terrain of the region.  Had any homes or buildings been in the way, they would have been heavily damaged and/or destroyed.

While we're still talking about the area just North of Birmingham, another tornado, this one of EF-4 intensity, struck from near Cullman on Northeast to halfway between Huntsville and Albertville.  The following YouTube video showing the tornado moving right through Cullman is quite impressive, and is well worth waiting through the 25 second commercial at the beginning:


Here is another view of the Cullman tornado, taken by someone standing out in their front yard:


Watch that video again.  If you didn't notice the first time, take a look at the front door and/or yard of each house in the video...


Did you notice that there is a person literally standing outside every one of the houses, looking at and/or taking some type of video of the tornado.  Why were they not in their shelters?  Granted, in hindsight, we know that the tornado was moving right to left and did not directly threaten this particular location, but did the people standing out there know that at the time?  Also, keep in mind that the Tuscaloosa tornado threw debris up to 20 miles away from the actual tornado.  An area as close to the tornado as we are seeing in this video would certainly be under a threat of flying debris.

Continuing on with this theme, the next video was shot from the 3rd story balcony of an apartment building.  This appears to be the Tuscaloosa tornado but it is not positively identified in the video.  Listen closely and you can hear the person taking the video remark about the debris flying in the air overhead, yet he stays out on the balcony filming.  You finally hear someone in the background say that it's time to get inside, once it has begun to move away, of course...


Don't get me wrong.  I enjoy watching the videos so that we can learn more about tornadoes, etc., but I would much rather watch video taken by a trained spotter or storm chaser that knows exactly what their location is in reference to how the tornado is moving and is safely out of harms way.  In other words, "don't try this at home" unless you know exactly what you're doing!


Thursday, April 28, 2011:

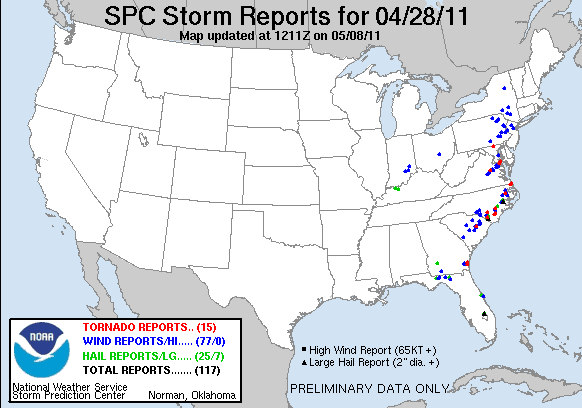
The final day of the 4 day outbreak, April 28, 2011, featured 49 confirmed tornadoes, mainly along the Eastern seaboard and the far Southeast:


There were no EF-4 or EF-5 intensity tornadoes on the 28th.  There were 3 EF-3 intensity tornadoes, 2 in Georgia (one West of Griffin and one Northwest of Forsyth) and one in Virginia (near Bristol).  Unfortunately, each of these 3 stronger tornadoes were killers.  There were 2 deaths associated with each of the EF-3 tornadoes in Georgia and 3 deaths associated with the EF-3 tornado near Bristol, Virginia.  Each of these stronger tornadoes took place during the pre-dawn hours of the 28th (or late on the 27th, depending on how you want to look at it), which explains their absence from the map above.

The most significant damage of the day was in association with the tornado near Bristol, Virginia (right along the Tennessee/Virginia borders).   It caused major damage in the Glade Spring area, including a truck stop that was heavily damaged along I-81 (might want to mute the musical selection - not sure it fits the material - but the photos are impressive):


For a complete tabular listing of each confirmed tornado during the April 25-28 outbreak, I recommend this Wikipedia link.


If you enjoy reading 'The Original Weather Blog', please be sure to "like" our facebook page!

Monday, December 26, 2011

#2 Weather Disaster of 2011: Southern and Southwest U.S. Drought


With total property and crop losses exceeding $10 billion, the severe drought and heatwave of the spring and summer (and drought continuing into the fall) across the Southern Plains and Southwest U.S. comes in at #2 on the list of billion dollar weather disasters of 2011.


With late winter and early spring rains lacking, the drought was already getting underway across much of Texas and New Mexico by mid-March:


...and would only worsen throughout the summer.  By August 30, extreme to exceptional drought conditions were present across much of the southern Plains and southwest U.S.:


Through December 26, 2011, much of central and eastern Texas still faces a  rainfall deficit of some 15-20 inches for the year, with much of New Mexico facing a deficit of 6-12 inches (note, the deficit is actually larger in some places that saw below normal values of rainfall toward the end of 2010):

Departure From Normal Rainfall for 1/1/11 - 12/26/11

The extreme drought took a heavy toll on livestock and crops across the South.  Not only did ranchers face drought on their own properties, but the widespread nature of the event caused hay and other livestock related feed prices to skyrocket.  Add the increased transportation costs to the mix (to bring feed and other resources in from areas that were not experiencing drought), and it put some family ranchers out of the cattle business altogether.


In Texas alone, drought related losses to livestock are estimated at $2.1 billion.  


Many may not have realized it, but the drought started to affect the pocketbooks of Americans by late summer and early fall, via increasing costs at the grocery store.  In Texas, the peanut crop was particularly hard hit by the drought, which resulted in a dramatic increase in cost in everything from peanut butter to mixed nuts across the country by the fall.

Other crops that took a hit from the hot and dry weather in Texas included wheat (estimated loss of $243 million) and corn (estimated loss of $327 million).


The cotton crop was the hardest hit of all, at an estimated $1.3 billion in Texas alone.


The American Farm Bureau estimated that Thanksgiving dinner cost Americans 13% more to prepare on average this year, compared to 2010 (a similar figure is being cited for your Christmas meal as well).  Among other things, beef prices are up 10-15% and poultry prices are up 15-20% on average (compared to one year ago).

Beneficial rains have fallen across much of the Northeastern portions of the region over the last 30 days:

Departure From Normal Rainfall for 12/1/11 - 12/26/11

...however extreme to exceptional drought conditions remain firmly in place across the majority of southern, central and western Texas into New Mexico and Arizona.  That trend is forecast to continue so for the foreseeable future:


...which will spell a continuation of further economic losses and strong pressure on food prices into at least the first half of 2012.


Editorial note:  The Texas and Southwest U.S. wildfires were not factored into the drought assessment.  When tabulating the list of billion dollar weather disasters of 2011, NOAA classified the wildfires separately.  With $1 billion in associated property losses so far, the Texas and Southwest wildfires of 2011 currently rank in the #12 spot on the list of billion dollar weather disasters of 2011.


If you enjoy reading 'The Original Weather Blog', please be sure to "like" our facebook page!

Friday, December 23, 2011

#3 Weather Disaster of 2011: Joplin Tornado and Associated Outbreak (May 21-26)...


If you're like me, when you think of May 22, 2011, your mind immediately turns to Joplin, MO and the tragic EF-5 tornado that changed that community forever (photo above courtesy twisterchasers.com).  It's hard to believe that the Joplin tornado was just one of over 180 confirmed tornadoes that took place during the period May 21-May 26, 2011.  The events of those 6 days caused $9 billion in property losses, placing it in the #3 spot for billion dollar weather disasters in 2011.

By far, the Joplin tornado was the deadliest and most damaging event of that week.  Over 160 lives were lost, with over 1,000 people injured.  Thousands of single family residences and hundreds of businesses were destroyed or heavilly damaged.  Insured losses in Joplin are currently estimated to approach $4.5 billion, or roughly one-half of the total damage caused by the events of that week.  

The Joplin tornado cut a swath of damage and destruction from West to East through the center of town:

US Army Corps of Engineers Satellite Damage Survey

NWS Ground-Truth Damage Survey

As you can see by examining the NWS damage survey on the image immediately above, nearly 50% of the tornado's track (which was over 1 mile wide at times) through Joplin produced EF-5 damage, with winds in excess of 200 mph.

The doppler radar velocity (wind speed and direction) image below is tightly zoomed in on the tornadic circulation as it passed the high school:


The radar signature within the white circle indicates a 210 mph wind taking place at the surface at that time.

A "debris ball" signature was frequently noted on radar reflectivity in association with the Joplin tornado, as debris were being lifted up and carried along by the tornado and surrounding circulation:


For more detailed information on the radar imagery associated with the Joplin tornado, please refer to this post.

As alluded to above, the damage in Joplin was extreme.  I was invited to visit the city and survey the damage just one week after the tornado took place.  I was equally horrified and gratified by what I saw.  Horrified by the real-life images of destruction (and yes, death), and gratified to see the "we will survive, we will rebuild" attitude of the vast majority of the folks that I had the pleasure to meet.

I have extensively documented the Joplin tornado event (including a very personal story of survival from a gentleman named Sam) as well as the ongoing recovery in posts throughout the year on this blog.  You can go to my Joplin Tornado Table of Contents post to view and/or read the related articles.

One of the most impressive (if that is the right word) sites that I observed while surveying the damage in Joplin was this brick home that was picked up off of its foundation and moved 8 feet before being sit back down:


You can clearly see the displacement in the photo below.  I have noted the distance from the outer most basement wall to the point where the home was laid back down, which was just over 8 feet in length:


The home above was located to the West of Main Street between 20th and 25th Streets (I won't reveal the exact location out of privacy concerns for the family).  Like the majority of the other homes on the block and in that neighborhood, it had a basement.  Conventional wisdom always says to seek shelter from a tornado in your basement, which is certainly good advice in most cases.  However, in the case of the Joplin, most of the basements in the direct path of the monstrous tornado were filled with debris as homes were lifted off of their foundations.  The image below is a look down into the basement of the same house that was moved 8 feet off of its foundation:


As you can see, bricks, concrete blocks and other parts of the frame crashed down into the basement below.

A similar result took place just two blocks away at Sam's home, but he had a tornado safe room in the corner of his basement which prevented him from being crushed and/or trapped by debris (see his remarkable story here).

I am planning a more detailed post regarding the basement sheltering issue in the near future, but I think the important take away, in a nutshell, is to get underneath a workbench, the stairway or some other sturdy piece of furniture (preferably one that is fastened to the ground) even when you seek shelter in a basement.  If you have room in your basement and can afford it, I would also suggest that you look at having a tornado saferoom built into one of the corners for added protection.

Meanwhile, the recovery in Joplin continues, and will do so for many months if not years to come.  The image below is just one of hundreds of "before and after" scenes that are taking place across the community:


As I mentioned off the top of this post, while certainly the most severe, the Joplin tornado was not the only event to take place during the $9 billion disaster week of May 21-26, 2011.

The events of that week actually began the day before, with an EF-3 tornado near Reading, Kansas:


Severe damage was reported with at least 20 homes destroyed and 1 person killed in Reading.  "Hundreds" of homes and businesses were reportedly damaged in association with the tornado.

The Reading tornado was one of 22 tornado reports that took place on May 21, 2011 (red icons on the image below):


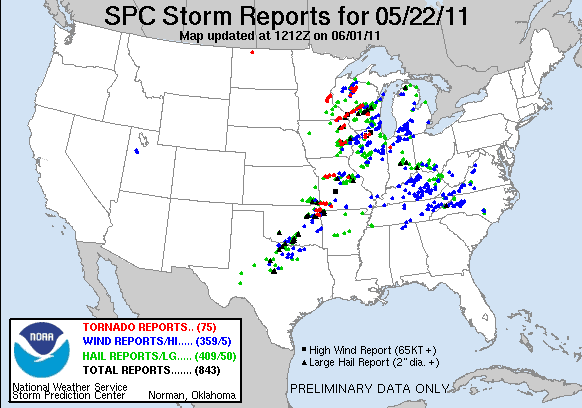
The Joplin tornado on the 22nd was one of 75 reported tornadoes that day:


On Monday the 23rd, the focus shifted to the Midwest and Ohio Valley, where the majority of 22 reported tornadoes took place:


Most of the tornadoes on the 23rd were of EF-0 or EF-1 intensity.  An EF-2 tornado was reported near Kellerville, Pennsylvania, and another was reported near Dover, Tennessee.  There were no deaths or serious injuries on this date.

A very active day took place on Tuesday the 24th, mainly over Oklahoma.  A total of 57 tornado reports were received on that day: 


An EF-5 tornado tracked from near Hinton to Guthrie in central Oklahoma (image below via NWS storm survey):


Nine people were killed as a result of this tornado, which is shown below when it was near Calumet:


Preliminary information from a scan of the tornado by the "Doppler on Wheels" research team suggests that peak winds were in excess of 210 mph with this tornado. This tree on the North side of El Reno was debarked, a phenomenon that we saw a lot of in Joplin, and is indicative of the most intense tornadoes that take place on earth:


When the tornado passed near the Oklahoma Mesonet weather observing station near El Reno, a peak wind gust of 151 mph was recorded, along with a dramatic drop in barometric pressure:


Another intense tornado tracked from near Chickasha to the south side of Oklahoma City (near the Newscastle area) on that day.  It was rated EF-4 intensity and resulted in 1 fatality (image via NWS storm survey):


The photo below shows the tornado when it was near Chickasha:


This particular tornado took a track just South of the devastating tornado that struck Moore in May of 1999.

Another EF-4 tornado tracked from near Bradley to Goldsby, just to the South of the Chickasha tornado track:


The photo below shows that particular tornado near Goldsby:


Late that evening (around Midnight) and into the pre-dawn hours of the 25th, an EF-3 tornado struck and did extensive damage to the town of Denning, Arkansas.  Most of the homes and businesses in Denning were extensively damaged or destroyed, and 4 people were killed.  The same storm produced another tornado a short time later near Clarksville, AR, where 1 person was killed.

Another big tornado day followed on the 25th, with 127 reports received:


While tornadoes were numerous and light to moderate damage was relatively widespread, the intensity of the tornadoes were less on that day - and no one was killed or seriously injured.

The strongest tornado, of EF-3 intensity, tracked from near Grandin to near Buckhorn in Missouri (image below via NWS storm survey):


The tornado rampage slowed considerably by the last day of the event, the 26th, with 16 reports received, mainly across the Ohio Valley and/or Northeast:


There were no fatalities nor any significant injuries on this date, and most of the tornadoes were of EF-0 or EF-1 intensity.  A strong tornado, rated EF-3 intensity, did take place in extreme southeast Louisiana, near Sun.

To return to the original post containing a recap of the record number of billion dollar weather disasters in 2011, please go here.


If you enjoy reading 'The Original Weather Blog', please be sure to "like" our facebook page!