First, a little radar refresher course for our newest readers. I'll be showing two types of radar images: Base Reflectivity and Storm Relative Velocity. Base Reflectivity images show the radar's depiction of rain, hail (and as you'll see in some images, debris), being reflected back to the radar. Storm Relative Velocity images show the wind speed and direction within the thunderstorm, as estimated by the radar.
When examining the storm relative velocity (SRV) images, keep in mind that the red colors depict wind motion away from the radar site, while the green colors depict wind motion toward the radar site. In this case, the radar site is located off of the images, toward the East/Northeast (or upper right).
Now that we have the basics out of the way...lets take a look at the images from that fateful day back in May...
The first series are Base Reflectivity images, starting at 5:34 PM CDT and ending at 5:58 PM CDT. The interval between each is about 5 minutes. Joplin is located just to the right of the center of each image (click to enlarge):
Reflectivity image at 5:34 PM CDT
Reflectivity image at 5:39 PM CDT
Reflectivity image at 5:43 PM CDT
Reflectivity image at 5:48 PM CDT
Reflectivity image at 5:53 PM CDT
Reflectivity image at 5:58 PM CDT
As you can see, a pronounced "debris ball" becomes visible at about 5:43 PM CDT, as debris is being lifted aloft and carried away by the tornadic storm. I've annotated the debris ball with a white circle in the images below:
Reflectivity image with debris ball at 5:43 PM CDT
Reflectivity image with debris ball at 5:48 PM CDT
Reflectivity image with debris ball at 5:53 PM CDT
The next series of images shows the same radar in Storm Relative Velocity (SRV) mode, at the same times as the above reflectivity images:
SRV image at 5:34 PM CDT
SRV image at 5:39 PM CDT
SRV image at 5:43 PM CDT
SRV image at 5:48 PM CDT
SRV image at 5:53 PM CDT
SRV image at 5:58 PM CDT
As you can see, the tornadic signature was initially moving East/Northeast and then turned more toward the East and then Southeast after crossing Highway 71 on the East side of Joplin. This corresponds well with the ground-truth damage survey as completed by the NWS:
Values inside the triangles correspond to EF intensity
I'll explore the change in track in greater detail in a later post dealing with the damage assessment as related to radar and satellite imagery.
Remember earlier when I pointed out that greens show the radar's estimation of wind blowing toward the radar site and reds show the wind blowing away from the radar? This is where we put that knowledge to use. I have taken the same SRV image shown above from 5:43pm and circled (in white) the rotation couplet as indicated by the radar in the image below:
Rotational couplet on radar peaked at 5:43pm CDT
At this point, the radar was estimating that wind speeds at the center of the white circled area were approximately 141 mph toward the radar and 69 mph away from the radar, for a total "shear" (or opposing wind motion) value of 210 mph at that point. It's important to keep in mind that the thunderstorm and associated tornado were about 50-55 miles from the radar site near Springfield at this point. At that distance, the radar was scanning the storm at a level between 4,000 and 4,500 feet above ground on the above image. Even with that in mind, the total wind motion value of 210 mph as estimated by the radar corresponds quite well to the ground-based storm survey which indicated damage consistent with winds in excess of 200 mph in this region.
You may have also noticed the small red "plus sign" and the small yellow dot located near Joplin on the above images. The red plus sign corresponds to the location of Sam's house, and the yellow dot corresponds to the location of Joplin High School. I thought it would be interesting to zoom-in at street level on a couple of selected radar images and take a look at how the radar signatures correspond with those hard-hit locations.
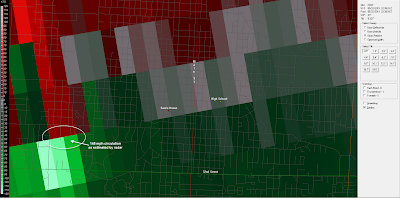
First, the Storm Relative Velocity (SRV) image at 5:39pm CDT, which shows the tornadic circulation growing stronger as it approaches Sam's neighborhood and the Main Street corridor. At this point, the radar was estimating 148 mph of total wind motion near the circulation center:
Zoomed-in SRV image at 5:39pm CDT with rotation noted
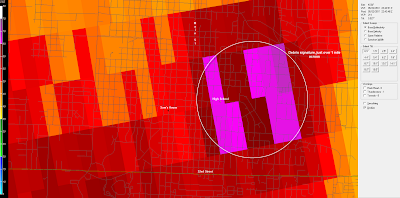
By 5:43pm CDT, just 5 minutes later, a pronounced debris signature was noted on the reflectivity image, extending just over 1 mile across, as debris was being lifted and carried aloft by the tornadic thunderstorm:
At the same time, the corresponding SRV image estimated 210 mph of wind motion in association with the circulation center, just to the East of the High School:
The satellite image below is zoomed-in on the same general area as shown above. You can see the level of destruction that took place along the path of the strong circulation center. The brown "swath" of damage in the satellite photo is about 1 mile wide on average, which also correlates quite well to the radar signatures above. I've added notations of the High School and Sam's House as further points of reference: (click to enlarge):
I'll be taking a much closer look at the damage as detailed by satellite and other imagery (photos, video, etc.) in an upcoming post on the damage assessment. I also plan to match-up some additional close-in radar images to correlate with the damage imagery as well.
For more on the Joplin tornado event, click here to return to the table of contents post, which contains a chronological listing of all related posts, and will be updated with new links as additional posts are made.
If you enjoy reading 'The Original Weather Blog', please be sure to "like" our facebook page!


2 comments:
Awesome post, Rob! I am just learning how to use grlevel2 radar, which looks like what you were using here. What does VCP 211 mean? Thanks for your help!
Anonymous/VCP:
Thanks for your comment/question. VCP stands for 'Volume Coverage Pattern' and has to do with the technical settings the radar operator has assigned to the radar unit at any given time. The VCP 211 setting is especially designed for situations involving severe weather within 60 miles of the radar.
On this setting the radar basically performs 16 (360 degree) scans every 5 minutes at 14 different elevation angles. It also takes into account some special angles and scan frequencies especially designed for severe weather monitoring.
Post a Comment