In blog posts of the past, I've mentioned El Nino (which means "the boy" in Spanish) and its affects on the weather, but I don't believe I've ever really delved into La Nina (which means "the girl in Spanish) before. Hence the reason for this post, which will describe the phenomenon and how it will have a dramatic affect on our fall and winter weather this year.
I apologize for the length of the post, but this is a very detail heavy subject. I've been pulling it together for 3 days now, which also adds to the length, but hopefully you'll come away with a full understanding of whats going on...
Here in Texas, we consider La Nina the evil step sister of El Nino because of its direct role in the extreme drought that we're now suffering through (more on that later). On a more scientific basis, La Nina is the opposite of El Nino, in that it represents the presence of cooler than normal waters in the Equatorial Pacific Ocean.
The image below shows the average of the observed sea surface temperatures along the Equator (top half of image) and the departure from normal in the same area (bottom half of image). Temperatures are in degrees Celsius, and I have added the locations of the Equator, Mexico and South America so that you can better orient yourself to the layout of the map:

As you can see, (and noted by the purple encircled region on the bottom half of the image), current sea surface temperatures (abbreviated SST) are below normal along that portion of the Equator along and to the West of South America. This is the typical La Nina "signature" on the SST map.
So, what exactly does La Nina do to the weather pattern here in North America? A graphic representing the "typical" impact for the fall and winter is shown below:

As you can see, the main branch of the jet stream (shown in purple) typically resides further to the North during a La Nina winter, particularly across the Western part of North America. This generally results in warmer and drier than normal weather across the southern U.S. (bad news for the drought areas) and cooler and wetter than normal weather from the northern Plains and Great Lakes into the Northeast.
As alluded to in the title of this post, the 2011-2012 fall and winter La Nina will be an "encore" presentation (as La Nina was also present during the 2010-2011 season). The jury is still out on just how strongly a "2nd year" La Nina affects the overall weather pattern. In some cases, the 2nd year phase has been just as strong as the first, while in others it has been weaker (and has less of an affect, as a result). This is why it's important, when making a longer range forecast, to not only apply the raw data to the forecast, but also apply the trend of the last several instances as well. You then have to keep in mind that there could be some "swing" in either direction (higher or lower, greater or lesser impact, etc.) when looking at the overall trend.
The graph below shows the instances of La Nina in the "modern" era (since 1950 - click to enlarge):
With the above in mind, the series of maps below illustrate how we would expect temperature and precipitation trends to behave (with respect to normal) during the fall and winter months of a La Nina pattern. These are called "analog" maps.
First, lets take a look at the likely temperature departures from normal for the period October through December (click to enlarge):

As indicated by the key on the lower left portion of the image, the red, orange and yellow shaded areas show a likely above normal temperature pattern, while the blues show regions where temperatures are more likely to fall below normal levels, on average. The darker the shading of either color scale, the higher the likelihood of above normal (reds/oranges) or below normal (blues/purples) temperatures in a given region.
I have attempted to "connect the dots" on the same image below, with above normal temperatures likely within the red hatched area, and below normal temperatures within the blue hatched area:

Below are the temperature analog maps for the period November through January:


...and for the period December through February (I didn't bother to do a connect the dot map for this one, as much of the nation is overtaken by the likelihood of above normal temperatures, as you can see):

We can do the same thing with respect to precipitation. First, the analog map for the period October through December:

On these maps, the brown and tan shaded areas show the likelihood of below normal precipitation, while the green shaded areas show the likelihood of above normal precipitation. The darker the green shading, the higher the likelihood of above normal precipitation. The darker the brown shading, the higher the likelihood of below normal precipitation in a given area.
When connecting the dots on this map (below), we can see a general trend for wetter than normal weather across much of the Northwest and northern Rockies, as well as the Great Lakes and Ohio Valley regions. Unfortunately, we see a trend toward continued dry weather in drought stricken Texas and the Southwest:

Here are the precipitation analog maps for November through January:


...and for the period December through February:


As you can see, this type of pattern does not bode well for drought stricken Texas, hence the reason that the Climate Prediction Center is currently forecasting "persistence" with respect to the drought:

Note the pockets of "Drought Ongoing, Some Improvement" (the green hatched areas over the brown) in Oklahoma and Kansas and along the Colorado/New Mexico border areas. The "improvement areas" correspond quite well with the precipitation analog maps for November through January (refer back to that image further up in the post), where precipitation is forecast to begin trending above normal during that period of time.
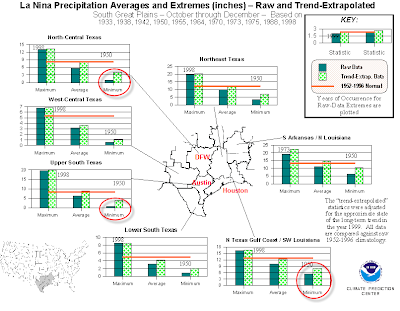
As I pointed out right before showing you the different analog maps, you have to keep the extremes in mind when looking at averages and/or departures from normal. Lets take a look at the potential precipitation extremes in drought stricken Texas under the fall and winter La Nina pattern.
The first image shows the probability of different amounts of precipitation in various parts of Texas during the period October through December. I have highlighted the Dallas/Ft. Worth area ("DFW" in red), the Austin area ("Austin" in red) and the Houston area ("Houston" in red). on both the small map and the data tables. Click on the image to enlarge it:

As you can see for the Austin/San Antonio area, there is a 66% chance of less than 6 inches of rain falling during the entire 3 month period of October through December when you look at the raw data (pie chart to the left of the word "Austin"). When you look at the trend adjusted data (pie chart to the right of the word "Austin"), there is still a staggering 60% likelihood of less than 6 inches of rain during the 3 month period. The normal for that time period would range from 6 to 9 inches (and keep in mind, we haven't seen a "normal" precipitation average in this region for nearly 12 months now).
If we look at the precipitation extremes for the Austin/San Antonio area under such a pattern (see image below), you can see that as little as 1 inch of rain has fallen in a La Nina pattern during that same time period (dark green shaded bar on the graph in the red circle). When adjusted for the trend of the last several data sets, the minimum amount rises to about 3 inches (spotted green shaded bar on the same graph).

The picture doesn't get much better when we look at the period January through March:

The raw data shows a 57% chance of below normal rainfall (a 50% chance when adjusted for recent trends) for the Austin/San Antonio area during the 3 month period. (Note that the precision, percentile wise, goes down as you progress out further in time). When we look at the extremes for the pattern in the Austin/San Antonio area, the average on the low end is for as little as 1 inch (raw data) to 2 inches (trend adjusted data) of rain during the entire 3 month period (red circled area on the bar graph image below).

This information is obviously very detail oriented and data heavy. For that reason I chose to focus on Texas in general (due to the drought) and the Austin/San Antonio area in particular. You can go to this link and pull the data for your region. It takes a little getting use to, but after playing around with the menu a little bit you should be able to pick it up pretty quickly...
Getting back to the bigger overall picture, when we take a look at the expected upper-air pattern and then pull all of the analogs, means and extremes together, a long range forecast is born. The next two images kind of pull everything together, as far as my thoughts are concerned, as to the general trends that we're likely to see this fall and winter.
First, lets take a look at the likely scenario for temperatures across the country. "Fall/Winter" describes the period October 1 through February 29 (yes, 2012 is a leap year), for purposes of this outlook...

The lighter blue and brown shaded regions indicate where I believe that there is a greater than 50% likelihood of below or above normal temperatures, respectively. The darker blue and darker brown shaded regions indicate where there is a greater than 70% likelihood of below or above normal temperatures, respectively.
Lets take a look at the same outlook with respect to precipitation trends:

Based on the expected trends, there is a greater than 80% chance of below normal precipitation across the darker brown shaded area in Texas, and a greater than 70% chance of the same in the darker brown shaded region over portions of Florida. There is a greater than 50% chance of below normal precipitation within the remainder of the lighter brown shaded regions.
I expect a greater than 50% chance of above normal precipitation within the lighter green colored regions. There is a greater than 80% chance of above normal precipitation across portions of the Pacific Northwest (darker green shaded area), and a greater than 60% chance of above normal precipitation across the darker green shaded areas in the Great Lakes and Ohio Valley.
As we proceed into October we'll have a much better idea as to how strong the La Nina is becoming, which will allow us to focus even more on the potential for extremes - and which of them are more likely to take place later in the season. There is another "wild card" in play, mainly during October, and that has to do with tropical systems that could affect Florida (and possibly Texas, though unfortunately that doesn't seem likely at this time). A strong tropical system impacting Florida, particularly if at low speed, would obviously negate the below normal rainfall outlook for at least the 1st month of the period (which happens to be October) for that region. Even in such a case, the overall pattern would likely revert back to a "below normal" rainfall situation for the remainder of the forecast period in that region.
Regardless of the particulars, there are a couple of headlines that are currently screaming from the likely pattern for this fall and winter:
(1). Texas is not likely to see a break in the rainfall department - the drought will rage on (and it could very well continue into the spring of 2012 and beyond).
(2). The "big cities" of the Midwest and Northeast should brace for some big snow days again this winter. Several of the top 10 heaviest snows in both Chicago and New York City have taken place in La Nina years.
(3). The higher elevations of the Pacific Northwest will have heavy snows this winter - and the lower elevations of the same region will have some big storms with high winds and heavy rain.
Stay tuned for updates as the season progresses!
If you enjoy reading 'The Original Weather Blog', please be sure to "like" our facebook page!
10 comments:
Just curious how this might translate to the Tulsa area? Last year in February we had that huge snowstorm that kept us all indoors for almost 2 weeks. Should we anticipate a repeat?
Planet Pink,
Thanks for the comment/question.
At one point I intended on mentioning that, but it got lost in the shuffle.
The unusually snowy winter you had this past season was during "year 1" of a La Nina pattern. The $64,000 question is how will La Nina "year 2" behave?
Even if you err on the side of caution and say that the year 2 La Nina will be weaker than year 1 (which remains to be seen), you would still go from "much above" normal snowfall to either "above normal" or "normal" snowfall for the Tulsa area.
My gut feeling at this point would be that you guys will see more snow than usual again this winter, but not to the extreme degree that you saw last winter.
We'll have to see how La Nina unfolds (strength-wise) in October and early November, which will give us a better indication as to how the remainder of the winter will pan out - especially with respect to the extremes of temperature and precipitation (like the very one you're asking about)...
Are you serious when you say the Texas drought will last through spring next year or even longer???
Anonymous/TX Drought, yes, I'm afraid so... Depending on how strong La Nina is this fall/winter, it could be next fall before normal rainfall trends return to Texas. We'll know more in about 2-3 weeks as we see how La Nina is setting up going into October...
this wasn't too long at all. thank you for taking the time to be so detailed. this is the best free information out there by a long shot... keep up the good work!
When you say Texas, you are talking about the state as a shole. correct? How about a prdiction just for the Houston area?
^prediction, sorry
^and whole, sorry
Anonymous/Houston,
Thanks for the comment/question. Houston would fall into the same category. Click to enlarge the 4 images with the pie and graph charts (toward the end of the post), and you can see where I've labelled the region that applies to Houston. There you can see the normal, lowest and highest amounts of rainfall that they usually observe during the expected pattern and time periods.
My hope earlier in the season was that we would at least see some tropical activity give Texas coastal areas and the adjacent plains some much needed rain before fall and winter arrive, but as you know, prospects of that are diminishing with each passing day as we head into October.
While it is still possible that we could see some type of tropical development in October that could impact Texas, the current trends would favor more of a Southeast US or Florida scenario rather than the Western Gulf.
Thanks, Rob. As soon as you can figure out in October what La Nina will do this winter and during 2012, please post it.
Post a Comment